Analysis · Working hypothesis
Bottom line for the board
Your current advantage has a sell-by date. Ring-fence around 30% of your innovation resources today to build the next one, the 70/20/10 split used by the best innovators, and ask to see it on the dashboard every quarter.
Key takeaways
- Companies are living shorter lives. The risk of being delisted within five years rose from 5% to 32% in half a century (BCG, 2015).
- Leading does not guarantee staying ahead. Only 17% of companies that outperformed their sector kept that edge five years later (MIT SMR, 2020).
- AI, across the whole journey. It speeds up every phase and makes imitation cheaper (working hypothesis).
Classic Strategy: Choose a Position and Protect It
A forty-year-old idea. Ever since Michael Porter published Competitive Advantage in 1985, strategy has been organised around sustainable competitive advantage: choose a position, raise barriers and defend it. The logic still holds; what has changed is how long that position lasts.
In an earlier reflection, “The advantage that cannot be cloned” (in Spanish), I argued that when everyone can buy the same tool, access stops being the differentiator.
The Data: Companies Are Living Shorter Lives
Corporate life expectancy is shrinking. The BCG Henderson Institute analysed more than 35,000 US-listed companies since 1950. Its findings:
- Five-year exit risk: from 5% fifty years ago to 32% (Reeves and Püschel, 2015). This includes mergers and acquisitions: not always a failure, but certainly the end of an independent path.
Even the elite is not immune. According to Innosight, average tenure in the S&P 500 fell from 61 years in 1958 to 18 in 2012, with a forecast of 15 for 2026.
What about Spain? In a different universe (all companies), the signal is consistent: according to Spain’s National Statistics Institute (INE), only 41.9% of companies born in 2018 were still active five years later.
AI on this curve. Apollo attributes the decline, among other factors, to successive technology waves (internet, cloud, mobile and now AI) that displace incumbents.
Question for the board: How old is the value proposition that generates most of your margin today, and when did you last review it in depth?
The Gravity of the Average: Leading Is Not Staying Ahead
Reaching the top is no longer staying there. A BCG study in MIT Sloan Management Review analysed more than 22,000 companies over four decades. Of those that clearly outperformed their sector average, only 17% kept that edge over the following five years. And that edge now erodes far faster than in the 1980s.
AI and the average. My reading: if everyone uses the same AI models in the same way, the pull towards the average grows stronger: same tool, similar results.
Question for the board: If your main competitor copied your flagship product tomorrow, what would still make customers choose you?
Transient Advantage: Harvest and Exit
A change of frame. In 2013, Rita Gunther McGrath (Columbia Business School) published “Transient Advantage” in Harvard Business Review and the book The End of Competitive Advantage. Her thesis: sustainable advantage is now the exception, and companies need a portfolio of transient advantages that are built quickly and abandoned in time.
Ten out of 4,793. Among listed companies worth more than US$1 billion, McGrath looked for those that grew net income by at least 5% every year between 2000 and 2009. Of 4,793, only ten did. They included a Spanish company, Indra Sistemas, alongside Infosys, Cognizant, FactSet and Slovenia’s Krka.
The wave. McGrath describes the life of each advantage as a wave with five phases: launch, ramp-up, exploitation, reconfiguration and disengagement. The key is not to wait for one wave to end before starting the next.
AI in each phase. It can detect signals to launch, scale growth, lower the cost of exploitation, recombine when reconfiguring and use data to decide when to exit.
Question for the board: Which phase of the wave is each of your business lines in, and which one is already being launched to take over from the one being exploited?
Three Levels of Evolution: Improve, Change or Create
Not all change is the same change. On the path of strategy, it pays to distinguish three levels of business evolution that are often lumped together:
- Digitisation: improving what exists. Applying technology to make an existing process, product or service more efficient.
- Digital transformation: changing how the business works. Redesigning processes, capabilities and experiences to deliver a structural, lasting improvement.
- Disruption: creating a new way to compete. Reconfiguring the value proposition or the business model to open up new opportunities and change the rules of the market.
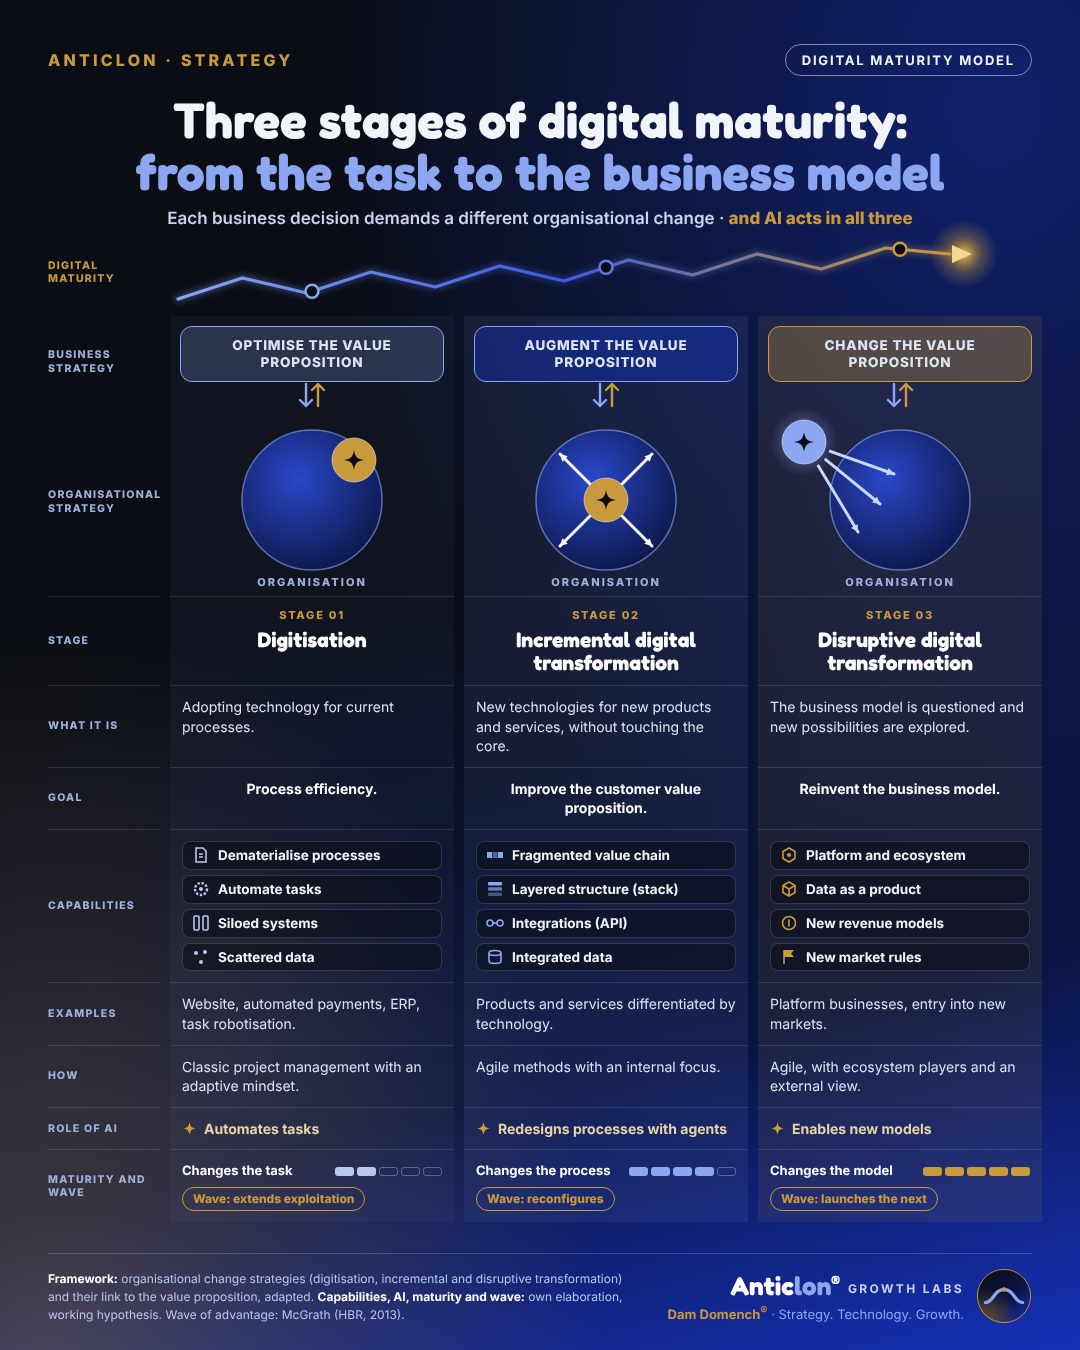
My reading (working hypothesis)
Digitisation extends the exploitation of the current advantage; digital transformation reconfigures it; disruption launches the next one. Those who only digitise are squeezing more out of an advantage that lasts less and less.
Question for the board: Of this year’s technology budget, how much improves what already exists, how much changes how the business works and how much prepares a new way to compete?
AI on This Map: An Accelerator of Imitation
My reading (working hypothesis)
AI does not invent transient advantage, but it accelerates it: it makes it cheap to copy what used to take years.
Question for the board: Of what sets you apart today, what could a competitor replicate in under six months with the same AI tools as you?
Porter Today: Cost, Differentiation or Focus?
The three generic strategies. In Competitive Strategy (1980), Porter set out three ways to compete: cost leadership, differentiation and focus on a segment.
My reading (working hypothesis)
When technology and AI become widespread, cost savings are the first thing to be copied. Differentiation only holds if it rests on what takes years to copy. And focus gains value, because deep knowledge of a segment provides context that no generic model has. The answer is not to pick one: it is to differentiate within a segment and renew that difference with every wave.
Question for the board: Does your advantage depend on cost, differentiation or a segment, and which could a competitor copy today?
Managing Waves, Not Fortresses: What Changes for Leadership
From fixed plan to portfolio. Leading looks more like managing a portfolio than defending a position:
- Portfolio review: classify each line by its phase in the wave.
- Small bets with milestones (discovery-driven planning): fund new waves in stages, with assumptions that are validated or discarded (McGrath and MacMillan, 1995).
- Planned exit: leave a fading advantage in time and free up resources for the next one.
- Early-warning signals: see “This model doesn’t predict, it warns” (in Spanish).
For the board dashboard
- Vitality index: share of revenue from lines launched in the last three to five years.
- Investment mix: share of the innovation budget going to the core, adjacent and transformational, against the 70/20/10 benchmark.
- Replication time: months it takes a competitor to match your latest launch. That is the real lifespan of your advantage.
Question for the board: When did your company last deliberately close a line, a product or a customer segment to free up resources?
How this analysis was done
- Sources: listed at the end.
- Working hypotheses: the three levels, the wave, the role of AI, the reading of Porter and the 30% (extrapolated from Nagji and Tuff). Not yet validated empirically.
From analysis to the boardroom. AI is governed not with tools, but with questions. This map sets out the seven questions a board should ask about the role of AI in strategy today.
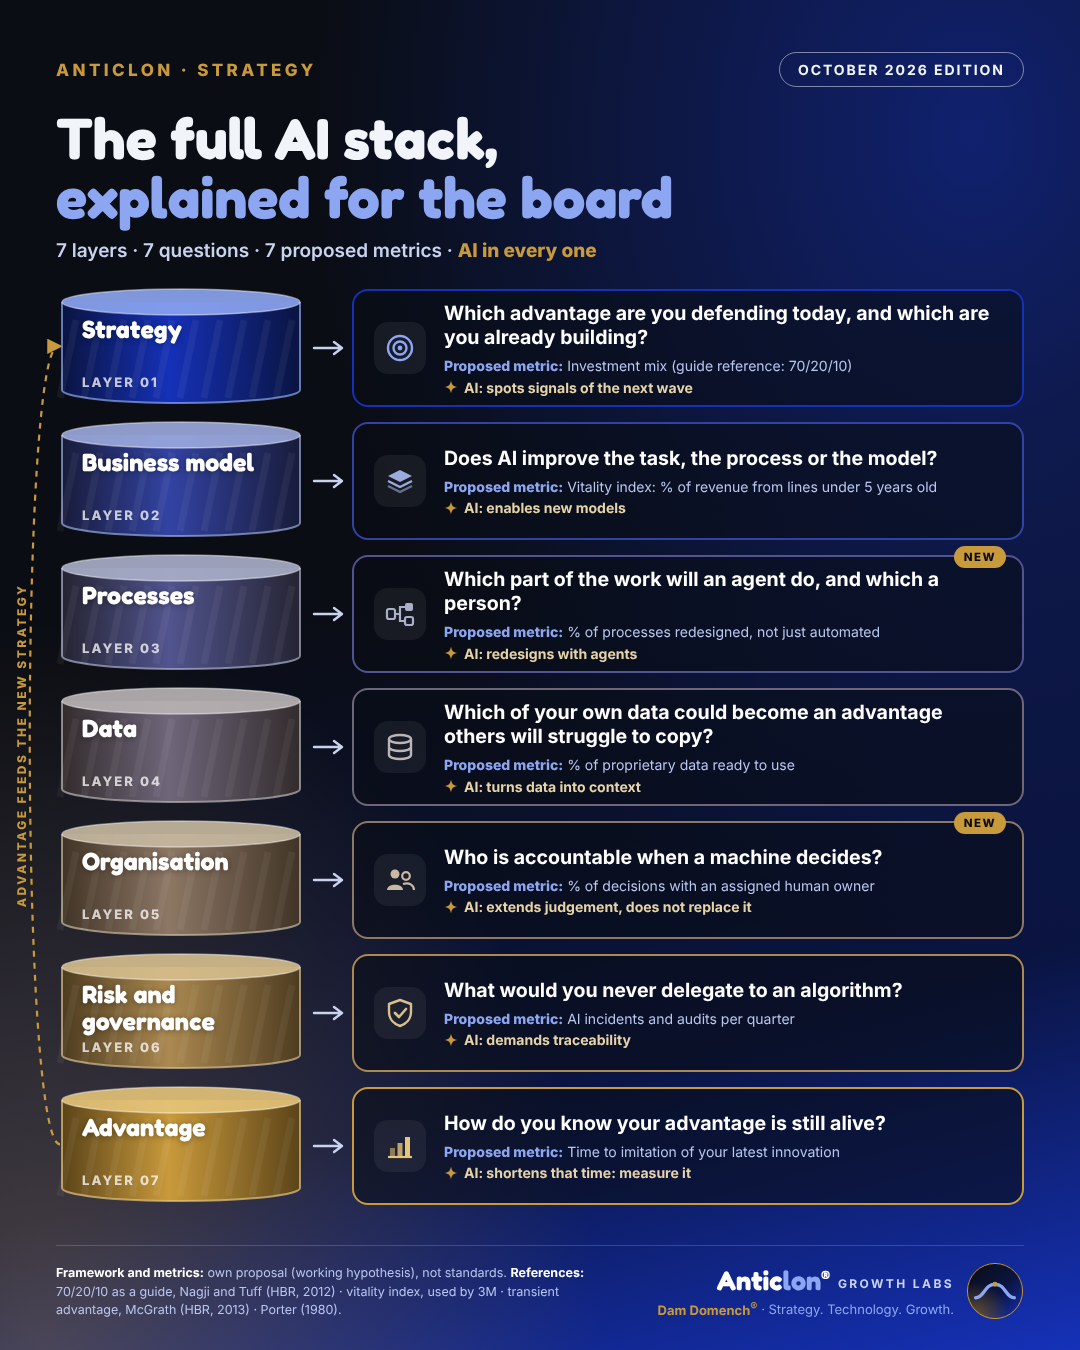
Food for Thought
Advantage is not dead. It has changed shape: it is no longer a wall, it is a movement.
The question that remains. The question is not whether Porter’s paths are still valid, but which one you leverage with AI: will you use it to cut what everyone else will also cut, or to deepen, within your segment, a difference others cannot copy?
Sources and further reading
- Nagji, B. and Tuff, G. (2012). “Managing Your Innovation Portfolio”. Harvard Business Review, May. hbr.org
- 3M (2026). Fourth-quarter 2025 earnings call (definition of the vitality index).
- Porter, M. E. (1980). Competitive Strategy. Free Press.
- Porter, M. E. (1985). Competitive Advantage: Creating and Sustaining Superior Performance. Free Press.
- Reeves, M. and Püschel, L. (2 December 2015). “Die Another Day: What Leaders Can Do About the Shrinking Life Expectancy of Corporations”. BCG Henderson Institute. bcg.com
- Reeves, M., Levin, S. and Ueda, D. (2016). “The Biology of Corporate Survival”. BCG Henderson Institute. bcghendersoninstitute.com
- Reeves, M., Whitaker, K. and Deegan, T. (2020). “Fighting the Gravity of Average Performance”. MIT Sloan Management Review. sloanreview.mit.edu
- McGrath, R. G. (2013). “Transient Advantage”. Harvard Business Review, June. hbr.org
- McGrath, R. G. (2013). The End of Competitive Advantage: How to Keep Your Strategy Moving as Fast as Your Business. Harvard Business Review Press.
- Kinni, T. (17 February 2014). “Rita Gunther McGrath on the End of Competitive Advantage” (interview). strategy+business. strategy-business.com
- McGrath, R. G. and MacMillan, I. C. (1995). “Discovery-Driven Planning”. Harvard Business Review, July–August.
- Innosight (2021). 2021 Corporate Longevity Forecast, reproduced in Slok, T. (1 March 2026), “Average Tenure of Companies in the S&P 500 Index”. Apollo Academy. apolloacademy.com
- INE, Spain’s National Statistics Institute (12 November 2025). Demografía Armonizada de Empresas. Año 2023 (press release). ine.es